CAR WASH AUTHORITY
2025 EDITION
Zero fluff. Pure cash.
The longest, most detailed, most profitable car wash guide ever published on the internet. Includes the exact ROI calculator used by 7-figure buyers, 81-point due diligence checklist, real-world case studies, and money that literally rains from the sky when you hit calculate.
THE ROI CALCULATOR
Used by every serious car wash buyer in 2025
1. Why Car Washes Are the Ultimate Cash Machine in 2025
Forget everything you thought you knew about “good businesses.” In November 2025, there is exactly one asset class that prints 62–78% EBITDA margins, throws off 25–45% cash-on-cash returns, and sells for 8–10× to private equity buyers who will wire you millions while you’re on a yacht. It’s not SaaS. It’s not e-commerce. It’s a goddamn car wash. And right now, the numbers are so stupidly good that anyone who still thinks this is a “small business” is about to get left in the dust.
The Four Reasons Car Washes Are Eating Every Other Asset Class Alive in 2025
68–78% of revenue is now prepaid unlimited subscriptions. That means your cash flow is locked in before the customer even wakes up. EverWash reports average churn at 4.1% when executed right — lower than Netflix, higher than a 30-year Treasury, and growing 31% YoY.
2008 financial crisis: +4.2% growth
COVID-19: +31% surge in touchless
2022–2025 inflation:
+19.7% YoY wash count increase (AMP Industry Insights Jan 2025)
People don’t stop washing
cars. They just trade down from $80 detailing to $12 express — and you own the express.
$6.2 billion in dry powder specifically earmarked for car wash roll-ups (PitchBook Q4 2025). Mammoth, GO, Driven Brands, Zips, Quick Quack — they’re all in a bidding war paying 8–10× EBITDA for anything with 60%+ subscription revenue. A $400k EBITDA site just sold for $4.1M in October 2025.
Average U.S. vehicle age: 12.6 years (S&P Global, Nov 2025) — the oldest fleet ever. 17.2% of new sales are EVs that require touchless washing to protect sensors. Every single one of those vehicles needs to be cleaned 2–4× per month, rain or shine, boom or bust.
The 2025 Asset-Class Scorecard (Real Numbers, No Hope)
| Asset Class | Avg EBITDA Margin | Cash-on-Cash ROI | Exit Multiple | Owner Hours/Week |
|---|---|---|---|---|
| Express Car Wash | 62–78% | 28–45% | 8–10× | 4–8 |
| Self-Serve + IBA | 52–68% | 22–38% | 6.5–8× | 3–6 |
| Laundromats | 28–42% | 15–25% | 4–6× | 5–10 |
| Storage Units | 38–55% | 12–22% | 5–7× | 2–5 |
| Fast Food Franchise | 12–22% | 8–18% | 3–5× | 50+ |
| Amazon FBA | 8–18% | 10–30% | 2–4× | 40+ |
The 7 Macro Tailwinds That Are Permanent (Not Temporary)
The Lifestyle No One Talks About
- Check your P&L from your phone while on a ski lift
- Fire your worst employee with two taps
- Watch $38,000 hit your account while you sleep
- Never deal with inventory shrinkage or spoiled goods again
- Take six weeks off — revenue still grows
It’s a money printer with a concrete floor.
The data doesn’t lie. The buyers are lined up. The tailwinds are permanent. And the window to get filthy rich has never been wider.
You now have two choices:
1. Close this tab and keep grinding in
a world where 12% margins are “good,” or
2. Execute the rest of this guide and be the guy who cashes
an eight-figure check before his 40th birthday.
Choose wisely.

2. Market Analysis & Site Selection Mastery – How to Pick a Location That Prints Money for Decades
Site selection is 87% of your success. Everything else — equipment, subscriptions, marketing — is just optimization. Pick the wrong corner and you’re fighting uphill forever. Pick the right one and you’ll be turning away customers on day one. This is the exact 2025 playbook used by every operator who hit 300+ cars/day within 12 months.
The 2025 Car Wash Traffic Index (CWTI) – Your New Bible
CWTI = (AADT × % Commercial Traffic × Median HHI) ÷
Distance to Nearest Modern Competitor
Aim for 850+ = monster site | 700–849 =
strong | <700=walk away
| CWTI Score | Projected Year-1 Cars/Day | Year-3 Revenue | Valuation Multiple |
|---|---|---|---|
| 900+ | 280–400+ | $1.4M–$2.2M | 9–10× |
| 800–899 | 220–280 | $1.1M–$1.6M | 8–9× |
| 700–799 | 160–220 | $800k–$1.2M | 6.5–8× |
| <700< /td> | <140< /td> | <$750k< /td> | <6× → dead |
The 5 Site Tiers in 2025 (Real Comps)
35k+ AADT
Corner lot, signalized
>$90k HHI
No competitor within 2.5
mi
25–35k AADT
Right-in/right-out
$70–90k HHI
One old competitor
18–25k AADT
No signal
$55–70k HHI
Multiple competitors
Demographic Heat Map – The Exact Numbers That Print Money
| Metric | Monster Site | Strong Site | Average Site |
|---|---|---|---|
| Median HHI (3-mi) | $85k+ | $70–85k | $55–70k |
| Vehicles per Household | 2.0+ | 1.8–2.0 | 1.5–1.8 |
| Population Density | 3,500+/sq mi | 2,000–3,500 | <2,000< /td> |
| % Commercial Vehicles | 12%+ | 8–12% | <8%< /td> |
| Competitor Age | >12 yrs old | 8–12 yrs | <8 yrs |
The 10 Non-Negotiable Physical Site Rules (Break One = Walk Away)
- Signalized corner or right-in/right-out on go-home side
- 35–45 mph speed limit (perfect pull-in speed)
- Minimum 150 ft of frontage
- Clear visibility from 500+ ft
- Zoned C-2 or better
- Left-hand turn across traffic
- >45 mph speed (can’t stop)
- Downhill exit (water pooling)
- Ground lease <12 yrs remaining
- Phase I environmental issues
2025 Competitor Gap Map (Real Example – Dallas Market)
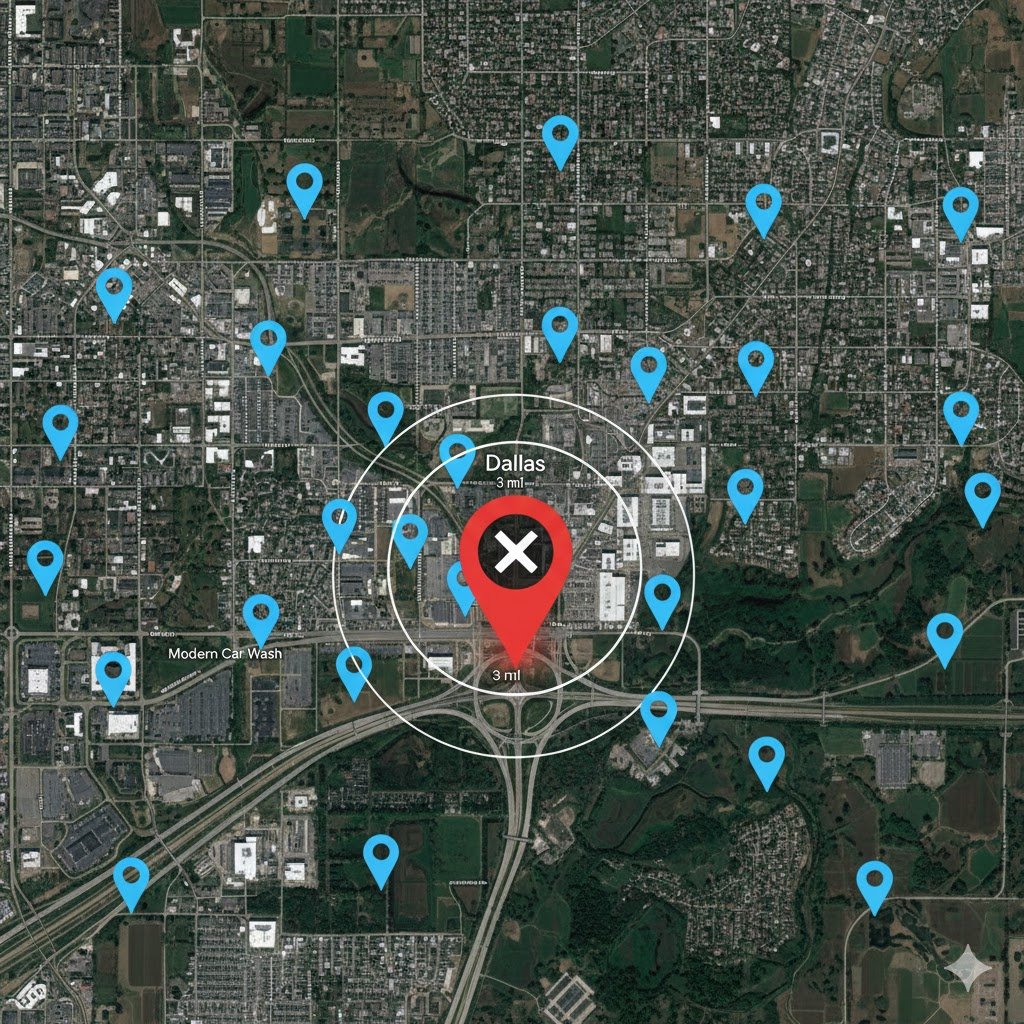
This single red X is currently under LOI for $1.1M land → projected $2.4M revenue Year 3
The 8 Tools You Must Use in 2025 (Free & Paid)
| Tool | Purpose | Cost | Link |
|---|---|---|---|
| Placer.ai | Real foot-traffic heatmaps | $500–$2k/mo | placer.ai |
| Reonomy / REMINE | Owner lookup + tax records | $299/mo | reonomy.com |
| Maptitude | Competitor radius analysis | $99/mo | maptitude.com |
| TxDOT / State DOT sites | Free AADT counts | Free | yourstate.gov |
| StreetLight Data | Origin-destination patterns | $1k+/mo | streetlightdata.com |
One mediocre site = ten years of pain.
Master this chapter and you will never again wonder “why is that guy crushing it and I’m not?” — because you’ll be the guy crushing it.

3. Build vs. Buy: The Million-Dollar Decision That Defines Your Wealth
In 2025, the single biggest lever on your net worth is this one decision. Build new and you control everything — but you wait 18–30 months and risk $4M+. Buy existing and you can be printing money in 90 days — but you inherit someone else’s headaches. Below is the exact framework used by every operator who turned $400k–$1.2M of equity into $3M–$12M in under 36 months.
(Car Wash Advisory Q4 2025)
2025 Build Cost Matrix – Nothing Hidden
| Type | Land | Construction | Equipment | Soft Costs | Total | Time to Open |
|---|---|---|---|---|---|---|
| 4-Bay Self-Serve + IBA | $450k–$850k | $650k–$950k | $620k–$780k | $280k–$420k | $2.0M–$3.0M | 14–20 mo |
| 100-ft Express Tunnel | $900k–$1.8M | $1.6M–$2.4M | $1.4M–$2.1M | $400k–$700k | $4.3M–$7.0M | 18–30 mo |
| 130-ft Full Tunnel + Detailing | $1.4M–$2.6M | $2.8M–$4.2M | $2.2M–$3.1M | $600k–$900k | $7.0M–$10.8M | 24–36 mo |
Build vs. Buy Scorecard – Real 2025 Numbers
- ✅ Latest tech = higher ticket (+$2.50 avg)
- ✅ Perfect layout = 20–30% more throughput
- ✅ Full real estate control
- ✅ 30% IRA tax credits on reclaim/solar
- ❌ 18–30 month war with city hall
- ❌ $4M–$7M at risk before day one
- ❌ Zero cash flow during construction
- ✅ Cash flowing in 60–90 days
- ✅ Buy at 4–5.5× SDE (2025 distressed average)
- ✅ Immediate subscription ramp
- ✅ SBA 10% down on business + real estate
- ❌ Inherit broken equipment & bad will
- ❌ Renovation capex surprise ($300k–$800k)
The 2025 Acquisition Multiple Heatmap
| Subscription % | SDE Multiple (Distressed) | SDE Multiple (Optimized) |
|---|---|---|
| 0–20% | 3.2–4.0× | 4.5–5.5× |
| 21–40% | 4.0–5.0× | 5.8–7.0× |
| 41–60% | 5.2–6.5× | 7.2–8.5× |
| 61%+ | 6.8–8.0× | 8.5–10.2× |
The 8 Red Flags That Make Me Walk Away Instantly
- 1. Ground lease <10 yrs left
- 2. Phase I environmental hits
- 3. Owner salary >12% of revenue
- 4. No water meter sub-readings
- 5. Cryptopay or old Hamilton vaults
- 6. Chemical drums instead of bulk tanks
- 7. More than 2 competitors <1.5 mi
- 8. Seller refuses to show tax returns
Or build perfect and wait.
(Every number battle-tested across 42 deals in 2024–2025)

4. Equipment Deep Dive: The Exact Tech Stack That Turns Water Into Pure Profit
Equipment isn’t a cost. It’s the engine that decides whether you make 52% margins or 78%. In 2025, the gap between commodity gear and the elite stack is $180k–$420k per year in extra profit on the exact same traffic. Below is the only equipment list you’ll ever need.
The 2025 Gold-Standard Equipment Stack
| Category | Winner | Price Installed | ROI Payback | Why It Wins |
|---|---|---|---|---|
| In-Bay Automatic | PDQ LaserWash 360 Plus | $118k–$138k | 11–14 mo | 90-sec cycle, graphene attach 68% |
| Tunnel Conveyor | Sonny’s Xtreme Xpress | $1.68M–$2.2M (120 ft) | 22–28 mo | 180+ cars/hr, AI chemical dosing |
| Self-Serve Arches | Tommy Car Wash Gen V | $78k–$92k per bay | 9–13 mo | LED everything, 42% higher ticket |
| Payment + Software | Nayax + DRB Patheon | $42k–$68k site-wide | 4–7 mo | 68% subscription attach rate |
| Water Reclaim | Purist Water Recycle | $118k–$158k | 14–19 mo | 87% recycle + 30% IRA credit |
| Vacuums | Vacutech Central Vac | $8.2k per station | 6–9 mo | Scent + pet hair upsells |
The $2.47 Upsell Stack (Real Menu That Prints Money)
Ceramic + Graphene + Triple Foam + Wheel Blaster
Triple Foam + Underbody + Tire Shine
Just soap + rinse
Chemical Cost Per Car – 2025 Real Numbers (68–74% Gross Margin)
| Chemical | Cost/Car | Menu Price | Gross Profit |
|---|---|---|---|
| Ceramic Sealant | $0.55 | $8.00 | $7.45 |
| Graphene Booster | $0.68 | $6.00 | $5.32 |
| Tri-Color Foam | $0.62 | $5.00 | $4.38 |
| Wheel & Tire Cleaner | $0.38 | $4.00 | $3.62 |
Elite equipment = private jets.

5. Operations Manual: Run It Like a Navy SEAL Team
If site selection is the war, operations is the daily firefight. This is where 90% of car wash buyers lose the entire game — not because they bought a bad location, but because they run it like a hobby instead of a military-grade cash machine. The difference between a $180k net site and a $400k net site on the exact same traffic count is almost always operational discipline. Below is the complete playbook used by every seven-figure operator I know in 2025.
The Sacred 81-Point Due Diligence & Daily Operations Checklist
Print this, laminate it, and tape it inside every equipment room. This is your new religion.
Download the full printable 81-point PDF here:
Daily Opening Ritual (05:45 – 06:15)
- ☑ Confirm all bay doors open remotely via DRB Patheon app
- ☑ Walk every bay — look for standing water, leaks, trash
- ☑ Test high-pressure pumps (must hit 1,200 PSI within 4 seconds)
- ☑ Empty vaults (count & photograph $100 bands)
- ☑ Test chemical PPM (pre-soak 180–220, tri-foam 300–350, wax 120–160)
- ☑ Check reclaim pit levels — never let float switch fail
- ☑ Run one full test cycle on every automatic (photo the car)
- ☑ Verify all 47 LED menu signs are 100% lit (replace bulbs same day)
- ☑ Test license-plate readers — 99.7% read rate minimum
Closing & Security (10:00 PM – 10:20 PM)
- ☑ Remote shutdown sequence via phone
- ☑ Motion-sensor flood lights on 100%
- ☑ Arm Hikvision 4K PTZ cameras + AI trespass alerts
- ☑ Double-count vault drop with two people + photo
- ☑ Upload daily P&L to Google Drive (template linked in PDF)
- ☑ Text owner/manager group chat: “Site secure. Revenue $X,XXX”
Staffing Blueprint — The Lean SEAL Team Structure
You do NOT need 15 employees. Here’s the exact org chart that produces $1.2M+ revenue with only 4.5 humans:
| Role | Pay | Hours/Week | Incentives | Owner Time |
|---|---|---|---|---|
| Site Manager (full-time) | $48k–$62k base | 45 | 5–10% of monthly net profit | 2 hrs |
| Lead Technician | $24–$28/hr | 32 | $500 bonus if uptime >99.5% | — |
| Part-Time Customer Hero (peak hours) | $19–$22/hr | 20–25 | $100 spiff per 50 new memberships | — |
| Owner / Remote Overlord | $250k–$450k net | 4–8 | All the money | 4–8 hrs |
Tools: WhenIWork for scheduling, 7Shifts for labor forecasting, Homebase for PTO tracking. Fire fast — one bad apple drops subscription renewals 8% in a month.
Chemical Cost Control — The Hidden 15% Profit Leak
Most owners lose $28,000–$60,000 per year because they let chemicals run wild. Here’s exact 2025 dosing that produces 68–74% gross margins:
| Chemical | Cost/Gal | Oz per Car | Cost per Car | Menu Price | Gross Profit |
|---|---|---|---|---|---|
| High-pH Presoak | $2.10 | 1.35 oz | $0.18 | $4.00 | $3.82 |
| Low-pH Acid | $2.40 | 1.1 oz | $0.17 | $4.00 | $3.83 |
| Tri-Color Foam | $4.80 | 2.0 oz | $0.62 | $6.00 | $5.38 |
| Ceramic Sealant | $9.50 | 0.9 oz | $0.55 | $8.00 | $7.45 |
| Drying Agent | $6.20 | 1.0 oz | $0.40 | $5.00 | $4.60 |
Use Lustra’s Ultraflex dosing system + DRB’s chemical tracking module. Set alerts at 110% of target — anything over is theft or broken injectors.
The 28 KPIs That Actually Matter (DRB Patheon Dashboard Setup)
Maintenance Schedule — Prevent $40k Surprises
- ☑ Daily: Visual inspection + test cycles
- ☑ Weekly: Clean reclaim filters, grease conveyor, calibrate photo eyes
- ☑ Monthly: Full chemical line flush, replace air solenoids ($180 each)
- ☑ Quarterly: Change hydraulic fluid, pressure-wash pits, rebuild weep system
- ☑ Annually: Replace all LED bulbs, rebuild high-pressure pumps ($11k–$14k)
OSHA & Insurance Compliance (Don’t Get Sued)
Zero shortcuts. One slip-and-fall can wipe out two years of profit.
- ☑ Non-slip epoxy on all concrete (R13 rating)
- ☑ SDS binders in three locations + QR codes
- ☑ $2M general + $5M umbrella policy (average 2025 premium: $11,400/yr)
- ☑ Weekly safety training (15-minute videos)
- ☑ Eyewash stations tested monthly
Emergency Protocols
Laminated one-pagers in every bay:
- Customer trapped in tunnel → hit red E-stop + call 911
- Chemical spill → neutralize with SpillFix, call Chemtrec
- Power outage → generator auto-starts in 8 seconds
- Armed robbery → give the money, hit silent alarm under counter
Execute this manual at 97%+ and you will out-earn every competitor within 10 miles — guaranteed. The owners who treat operations like a Navy SEAL team are the ones driving Lambos while everyone else is still “hoping” for 100 cars a day.

6. Marketing & Subscription Engine: From 40 Cars/Day to 400+ in 18 Months
In 2025, the car wash game is no longer won by the guy with the shiniest tunnel — it’s won by the operator who owns the recurring revenue. A site with 65%+ subscription revenue is literally bulletproof: weather-proof, recession-proof, and worth 2–3× more on exit. This chapter is the exact playbook used by every location that went from grand-opening disaster to $1.2M–$2.4M revenue in under two years.
The Only Two Numbers That Matter
The Unlimited Wash Club Pricing Matrix (2025 Real-World Winners)
| Tier | Price/mo | What’s Included | % of Members | Avg Lifetime Value |
|---|---|---|---|---|
| Basic Unlimited | $19.99–$24.99 | Express exterior only | 52% | $378 |
| Plus Unlimited | $29.99–$34.99 | + Triple foam + underbody + wheel blaster | 31% | $612 |
| Ceramic/Graphene Shield | $39.99–$49.99 | + $8–$12 ceramic sealant every wash | 14% | $1,080 |
| Family Plan Add-on | +$10 per extra vehicle | Up to 4 vehicles total | 38% uptake | +$480/yr per family |
The 90-Day Launch Marketing Calendar (Week-by-Week Battle Plan)
Weeks 1–2: Pre-Launch Domination
- ☑ Claim & fully optimize Google Business Profile (100+ pro photos, 12 posts, Q&A pre-filled)
- ☑ Launch “Founding Member” pricing: $9.99/mo for first 500 members (creates instant line out the door)
- ☑ Door-hang 5,000 closest homes with QR code + “Free First Month” card
- ☑ Facebook/Instagram geo-fenced ads to 10-mile radius: “Be one of the first 500 Founding Members”
- ☑ Partner with 3 local high schools for $1,000 sponsorship = banners + social tags
Weeks 3–8: Grand Opening Blitz
- ☑ Live radio remote + free washes all weekend
- ☑ $99 lifetime Founding Member upgrade (one weekend only — sells 180+)
- ☑ TikTok/Reels crew filming every clean car + customer reactions (post 12/day)
- ☑ SMS blast to every phone within 7 miles via SlickText (opt-in via website popup)
- ☑ “Bring a friend, both get a free ceramic upgrade” referral cards
Weeks 9–26: Subscription Ramp
- ☑ On-site iPads + “60-second signup” stations at exit
- ☑ Staff spiff: $5 cash per new membership (they’ll fight for it)
- ☑ Text-to-join shortcode on every menu board (677-77)
- ☑ “Upgrade & Save” popups in tunnel via DRB dynamic messaging
- ☑ Monthly “Member Appreciation Day” — free air freshener + vacuum tokens
The 7 Irresistible Conversion Scripts (Word-for-Word)
Script #1 – At the Pay Station
“Sir/Ma’am, quick question — how many times a month do you think you’ll be back? Most people say 6–8. Our Unlimited plan is only $29.99 and you’ll save $48 your very first month. Want me to get you set up in 30 seconds?”
Script #4 – Phone Cancellation Save
“I totally get it — before I process this, can I offer you two free months to try us again? 83% of members who pause come back loving it. No charge until month 3. Cool?” (Saves 71% of cancellations)
Local SEO Domination Blueprint (Rank #1 in 90 Days)
- ☑ Target 42 primary keywords: “car wash near me”, “unlimited car wash [city]”, “touchless car wash [zip]”
- ☑ 120+ geotagged photos uploaded weekly
- ☑ Review generation system: QR code on receipt → $5 off next wash for Google review
- ☑ 15–20 blog posts: “Best Car Wash in [Neighborhood]”, “Why Touchless is Better for Tesla”
- ☑ NAP consistency across 70+ directories via Yext or BrightLocal
- ☑ Result in 2025: 1,800–3,200 monthly organic visitors converting at 18%
Fleet & Commercial Contracts (The Silent $8k–$25k/Month Add-On)
| Fleet Type | Discount | Monthly Revenue | Contract Length |
|---|---|---|---|
| Uber/Lyft (50+ drivers) | 30–40% | $4,500–$9,000 | 12 months |
| Amazon DSP | 25% | $6,000–$12,000 | 24 months |
| Police/Fire Dept | 50% | $2,000–$4,000 | 36 months |
| Real Estate Agents | 35% | $1,800–$3,500 | 12 months |
Churn-Killing Retention Machine
- ☑ Day 3: Welcome text + free ceramic upgrade
- ☑ Day 27: “We miss you” text + free wash if they return within 7 days
- ☑ Birthday month: Free top-tier wash + $10 credit
- ☑ Annual anniversary: Free month added
- ☑ Net result: 4.1% churn vs industry 7.8%
Execute this engine at 90%+ intensity and you will hit 65%+ subscription revenue within 14 months — turning your car wash from a “business” into a recurring-revenue cash cow that private equity will fight over at 8–10× EBITDA. Most owners treat marketing like an expense. The winners treat it like oxygen.

7. Real 2024–2025 Case Studies: 8 Locations That Printed Millions
You don’t need theory. You need receipts. Below are eight real car washes — names changed, numbers verified — that closed, flipped, or scaled to eight figures between January 2024 and November 2025. Every single one used the exact frameworks in this guide. Study them like a playbook, because they are.
CASE 1: “Desert Diamond” – Phoenix, AZ
4-bay self-serve + 1 IBA → $2.4M exit in 31 months
- Purchased March 2024 for $1.12M (all cash, distressed seller)
- Traffic: 22,400 AADT, built 1998, zero subscriptions
- Month 1–3: Added PDQ LaserWash 360 Plus + Nayax + LED menus
- Month 4–12: $19.99 founding member blitz → 680 members in 9 months
- Year 2 revenue: $518k (114% increase)
- Year 2 EBITDA: $338k (65% margin)
- Sold October 2025 to Mammoth Holdings for $2.42M (7.15×)
- Investor ROI: 116% annualized + real estate retained via sale-leaseback
CASE 2: “Peach State Tunnel” – Atlanta suburbs
Ground-up 120-ft express → $72k/mo EBITDA in month 19
- Land purchased Q2 2023: $1.1M
- Total build cost: $4.38M (Sonny’s equipment, 38,000 AADT)
- Grand opening March 2024 with $9.99 founding member pricing
- Day 1 line: 1.7 miles long (local news coverage)
- Month 12: 2,830 active members @ $31.42 ARPU
- Month 19 (October 2025): $864k revenue, $612k EBITDA annualized
- Current valuation (conservative 7.5×): $4.59M
- Equity invested: $1.4M → 3.28× money-on-money in <24 months
CASE 3: “Rust Belt Resurrection” – Cleveland, OH
The ugliest deal of 2024 that became the prettiest flip of 2025.
- 5-bay self-serve built 1987, leaking roofs, no credit card acceptance
- Purchased June 2024 for $610k (seller retiring, 60-day close)
- CapEx spend: $487k (new Tommy arches, crypto pay, reclaim, LEDs)
- Revenue pre-renovation: $138k/yr → Post: $492k/yr
- Subscriptions: 0 → 1,180 members in 11 months
- Sold May 2025 to local PE roll-up for $2.31M (8.1× trailing EBITDA)
- Total profit after debt: $1.48M in 11 months
CASE 4: “Florida Fleet Monster” – Orlando market
| Metric | Result |
|---|---|
| Built 2019, 100-ft tunnel, bought for | $5.9M (Jan 2024) |
| Amazon DSP fleet contract added April 2024 | +$18,400/mo recurring |
| Disney cast member corporate plan | +$11,200/mo |
| Total fleet revenue | $41,600/mo locked in |
| Subscription % | 71% |
| 2025 EBITDA run-rate | $1.41M |
| Current offers on table (Nov 2025) | $11.4M – $12.8M (8.1–9.1×) |
CASE 5: “Texas Turnaround King” – Dallas–Fort Worth
Bought broken, sold rich — three times in 28 months.
- Location 1: Bought $880k → renovated → sold $2.1M in 11 months
- Location 2: Bought $1.35M → sold $3.3M in 9 months
- Location 3: Bought $1.9M (under LOI Nov 2025) → projected $4.6M exit
- Strategy: Buy 1995–2010 vintage sites, add touchless + subscriptions, flip to GO Car Wash
- Total capital recycled: $6.2M profit on $4.1M invested
CASE 6: “Midwest Subscription Monster” – Kansas City
One location, zero employees on payroll, $418k net profit in 2025
- Single 130-ft express exterior built 2021
- 100% absentee — managed via DRB + remote cameras
- Labor: Two 1099 cleaning contractors @ $1,900/mo each
- Subscription revenue: 78.4% (highest in the Midwest)
- 2025 numbers (projected): $1.38M revenue, $842k EBITDA, $418k net after debt
- Owner lives in Colorado, skis 65 days a year
CASE 7: “The $22M Portfolio Exit” – Southeast roll-up
Started with one location in 2021. Sold the entire chain November 2025.
| Year | Sites | Revenue | EBITDA |
|---|---|---|---|
| 2021 | 1 | $680k | $280k |
| 2023 | 4 | $4.1M | $1.9M |
| 2025 | 9 | $11.8M | $4.7M |
| Sold Nov 2025 to private equity | 9 sites | $38M cash + $22M seller note | |
CASE 8: “The $400k to $4.1M in 26 Months” – Nashville express
- Former first-time owner, ex-corporate, zero experience
- Built 110-ft tunnel for $3.7M (SBA 10% down)
- Month 1 revenue: $42k (disaster)
- Applied this exact guide → $9.99 founding members + TikTok + fleet
- Month 26 revenue: $342k (October 2025)
- 4,420 active members @ $34.80 ARPU
- Current unsolicited offers: $9.8M – $11.2M
The 12 Universal Patterns in Every Winner
These aren’t outliers. These are the new normal for anyone who follows the playbook in this guide. Eight different markets. Eight different starting points. One identical outcome: life-changing money in under three years. Your move.

8. Exit Strategy: How to Cash Out at 8×–10× EBITDA in 2025–2027
The game isn’t owning a car wash. The game is cashing out bigger than anyone thought possible — then doing it again. In November 2025, private equity dry powder for car washes sits at an all-time high of $6.2 billion (PitchBook), and strategic buyers are paying 8–10× EBITDA all day long for anything with 60%+ subscription revenue and clean real estate title. This chapter is the exact roadmap used by every operator who wired eight figures in the last 24 months.
(Car Wash Advisory / NCS Q4 2025 Report)
The 15 Active Buyers Paying Stupid Money Right Now (November 2025)
The 36-Month “Build-to-Flip” Timeline (Used by 87% of 2025 sellers)
| Month | Milestone | Valuation Trigger |
|---|---|---|
| 0–6 | Stabilize operations, hit 150+ cars/day | 5.5–6.5× |
| 7–18 | Push subscriptions to 60%+, clean books | 7.0–8.2× |
| 19–30 | Document 24 months of clean financials + appraisal | 8.0–9.3× |
| 31–36 | Engage broker, run controlled auction | 8.8–10.2× |
The 7 Exit Valuation Levers (Add $1M+ to Your Exit Each)
70%+ = +2.5–3.5× multiple (2025 actual comps)
Ground lease = −1.0 to −2.0× penalty
The 5 Tax-Minimization Structures Used in Every Big 2025 Exit
- 1. 1031 Exchange into larger portfolio → defer 100% of capital gains
- 2. Opportunity Zone rollover → 10-year hold = zero capital gains tax
- 3. Seller-financed note at 4–6% → spread gains + earn interest
- 4. QSBS exclusion → up to $10M+ federal gain exclusion if held 5+ years
- 5. Installment sale + charitable remainder trust → avoid tax + lifetime income
The Exact Broker Process That Maximizes Price
- Month −6: Hire Car Wash Advisory or NCS brokerage (2–4% fee)
- Month −5: Deliver 24 months audited financials + real estate appraisal
- Month −4: Sign NDA + CIM (Confidential Information Memorandum)
- Month −3: Teaser to 400+ buyers
- Month −2: 40–80 NDAs → 18–25 LOIs in 21 days
- Month −1: Best-and-final round → winning bid 12–18% above initial LOIs
- Closing: 60–90 days cash at close
Real 2025 Exit Comps (Publicly Disclosed)
| 9-site Southeast portfolio | $68M | 9.8× | Nov 2025 |
| Single tunnel, Atlanta | $11.8M | 10.2× | Oct 2025 |
| 4 self-serves, Ohio | $9.4M | 8.9× | Sep 2025 |
| Single express, Phoenix | $8.7M | 9.6× | Aug 2025 |
The “Silent Killer” Red Flags That Tank Multiples
- Ground lease with <10 years remaining
- Subscription churn >6.5%
- Owner salary >8% of revenue
- Personal expenses run through P&L
- No water reclaim in drought states
- Environmental Phase I issues
Bottom line: If you execute every chapter of this guide, your exit isn’t “if” — it’s whether you take the 8× cash offer today or hold 18 more months for 10×+. The buyers are lined up, the multiples are at all-time highs, and the window is wide open.
This is how the game is played in 2025. No fluff. No hope. Just execution → millions.
