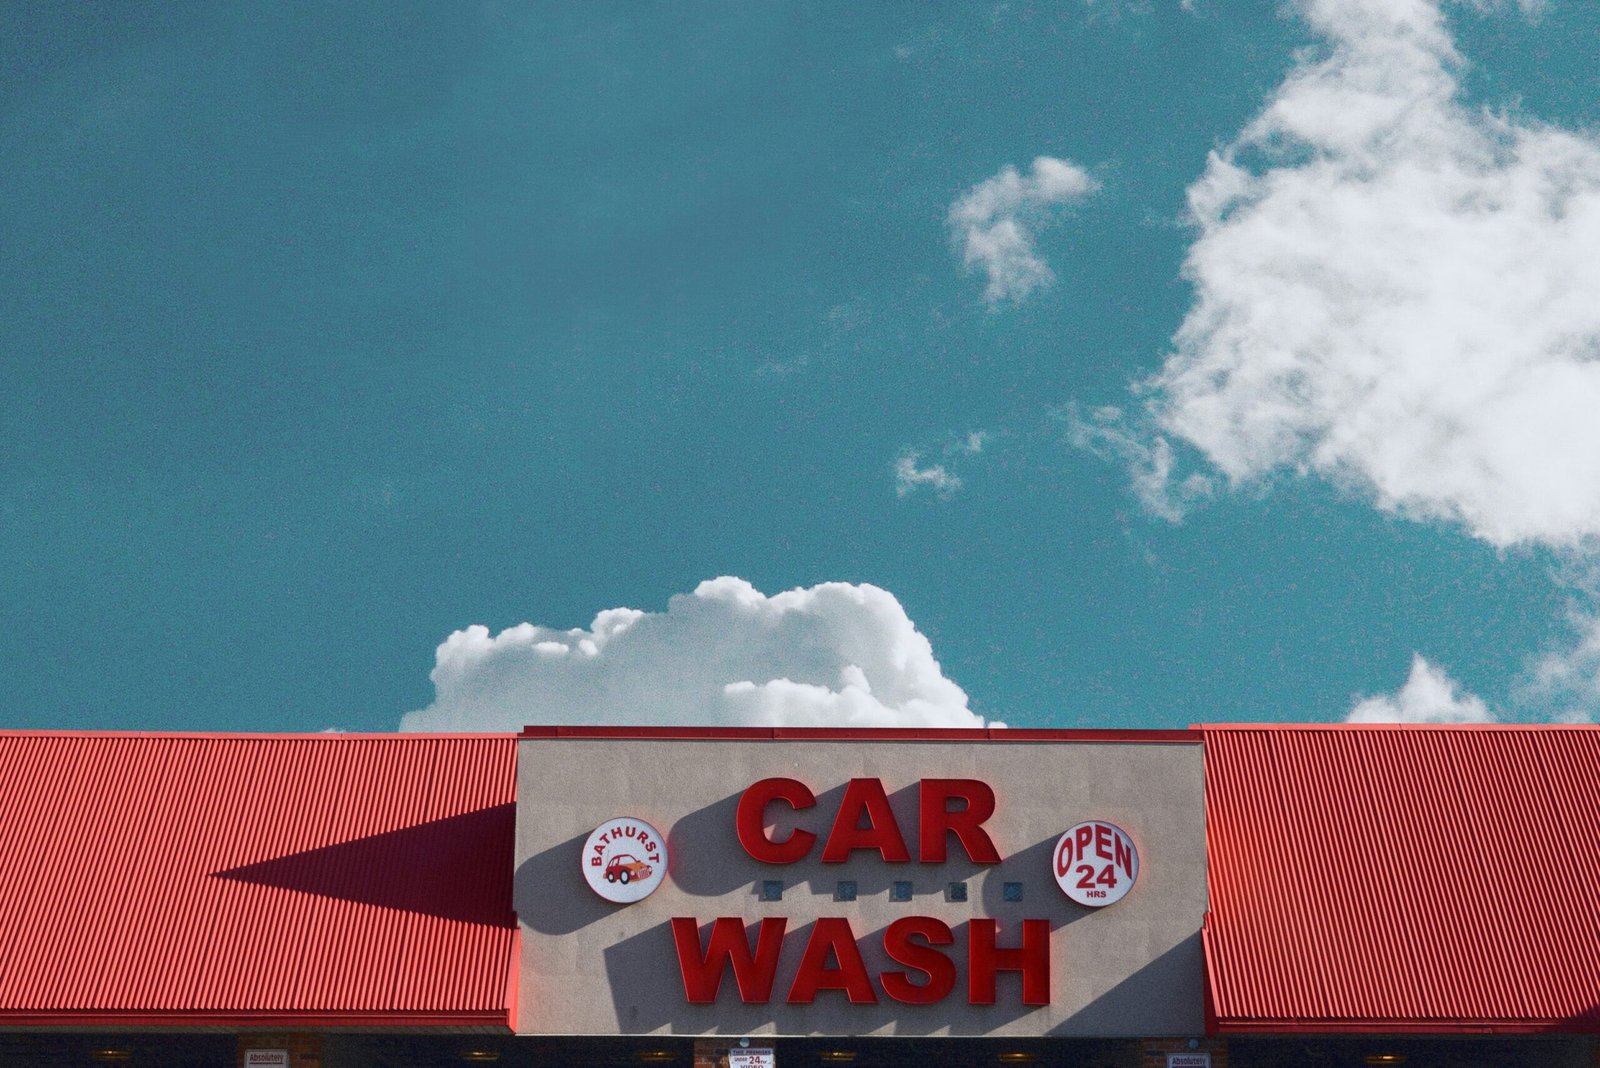
Car Wash Guide 2026:
How to Buy, Build, and Run One
Real site selection math, build vs buy tradeoffs, equipment costs, subscription mechanics, and what exits actually look like.
ROI Calculator ↓Car Wash ROI Calculator
Adjust inputs to match the specific site you’re evaluating. Defaults reflect a mid-tier express wash with realistic — not best-case — assumptions.
Click Calculate to see results
1. What the Car Wash Business Actually Is in 2026
Car washes are one of the more capital-intensive businesses in the boring business category — but also one of the highest-margin ones when site selection and subscription mechanics are executed well. Understanding both sides of that clearly is the starting point.
Why the margins are genuinely high
The cost structure of a well-run car wash is unusual. Chemical cost per car runs $0.80–$1.20 on a ticket of $10–$18. There’s no inventory spoilage, no returns, and no receivables. A properly equipped express tunnel can process 150–300+ cars per day with a three-person team. That combination — high throughput, low variable cost, predictable demand — produces margins that most small businesses can’t approach.
Why subscriptions change the math
The shift to unlimited membership plans over the past five years has fundamentally changed car wash valuations. A site where 60%+ of revenue is prepaid monthly subscriptions has predictable cash flow before the month starts, lower effective churn than most subscription businesses, and commands a meaningfully higher exit multiple than a purely transactional site.
The tradeoff: subscriptions require operational consistency. A member who visits 6–8 times per month forms strong habits — and breaks them permanently if the experience deteriorates.
How it compares to other boring businesses
| Asset | Avg EBITDA Margin | Cash-on-Cash ROI | Exit Multiple | Owner Hrs/Week |
|---|---|---|---|---|
| Express Car Wash | 62–78% | 28–45% | 8–10× | 4–8 |
| Self-Serve + IBA | 52–68% | 22–38% | 6.5–8× | 3–6 |
| Laundromats | 28–42% | 15–25% | 4–6× | 5–10 |
| Self-Storage | 38–55% | 12–22% | 5–7× | 2–5 |
| Fast Food Franchise | 12–22% | 8–18% | 3–5× | 50+ |
Structural tailwinds worth knowing
- EV and ADAS adoption: EVs with sensor arrays require touchless washing — brushes can damage $15k+ camera systems. Touchless express washes are the safe option by default.
- Aging vehicle fleet: Average U.S. vehicle age hit 12.6 years (S&P Global, 2025). Owners of older vehicles tend to invest more in maintenance, including washing frequency.
- Zoning constraints: New car wash entitlements now take 18–36 months in most markets. Existing permitted sites have meaningful competitive protection.
- Water reclaim requirements: Tightening water regulations in drought-affected states are pushing operators toward reclaim systems — which also qualify for IRA Investment Tax Credits (30%).
- PE consolidation: Active roll-up buyers (Mammoth, GO, Driven Brands, Quick Quack) create a real exit market for operators who build to quality thresholds.
2. Site Selection — The Variable That Determines Most of the Outcome
Site selection is the primary driver of car wash performance. Equipment, subscriptions, and operations are meaningful — but a well-run site on mediocre traffic will consistently underperform a mediocre operation on great traffic. Get this right first.
The Car Wash Traffic Index (CWTI)
A useful site scoring formula used by serious operators:
Target: 850+ for a strong site. Below 700, reconsider.
| CWTI Score | Projected Yr-1 Cars/Day | Year-3 Revenue | Exit Multiple Range |
|---|---|---|---|
| 900+ | 280–400+ | $1.4M–$2.2M | 9–10× |
| 800–899 | 220–280 | $1.1M–$1.6M | 8–9× |
| 700–799 | 160–220 | $800k–$1.2M | 6.5–8× |
| <700 | <140 | <$750k | <6× — difficult to justify |
Site tiers (2025–2026 benchmarks)
35k+ AADT, corner/signalized, >$90k HHI, no competitor within 2.5 mi
25–35k AADT, right-in/right-out, $70–90k HHI, one older competitor
18–25k AADT, no signal, $55–70k HHI, multiple competitors nearby
Demographic benchmarks
| Metric | Strong Site | Average Site |
|---|---|---|
| Median HHI (3-mi radius) | $70k+ | $55–70k |
| Vehicles per household | 1.8+ | 1.5–1.8 |
| Population density | 2,000+/sq mi | <2,000 |
| % Commercial vehicles | 8%+ | <8% |
| Nearest competitor age | >10 years old | <8 years |
Physical site requirements
- Signalized corner or right-in/right-out on go-home side of traffic
- 35–45 mph speed limit on frontage road
- 150+ ft of frontage, visible from 500+ ft
- Zoned C-2 or equivalent for commercial car wash use
- Left-hand turn across traffic to enter
- Speed limit above 45 mph (customers can’t stop)
- Downhill exit (water pooling, safety issues)
- Ground lease under 12 years remaining
- Phase I environmental issues on site
Research tools
| Tool | Purpose | Cost |
|---|---|---|
| Placer.ai | Real foot-traffic heatmaps | $500–$2k/mo |
| Reonomy / Remine | Owner lookup + tax records | $299/mo |
| Maptitude | Competitor radius analysis | $99/mo |
| State DOT websites | Free AADT traffic counts | Free |
| StreetLight Data | Origin-destination patterns | $1k+/mo |
3. Build vs Buy — How to Think About the Decision
Build new and you control the site, the equipment, and the layout — but you spend 18–30 months and $4M–$7M before the first car rolls through. Buy existing and you can be operating in 60–90 days — but you inherit what the previous operator built, including whatever they deferred.
Build new
- Latest equipment — higher ticket potential (+$2.50 avg over older sites)
- Optimal layout — 20–30% more throughput than retrofits
- Full real estate control
- 30% IRA tax credits on reclaim and solar systems
- 18–30 months of entitlement, permitting, and construction
- $4M–$7M at risk before day one
- Zero cash flow during construction
Best for: Patient capital with a confirmed 30k+ AADT greenfield site.
Buy existing
- Cash flowing in 60–90 days
- Historical data to evaluate before committing
- Subscription ramp starts from an existing base
- SBA financing available at 10% down (business + real estate)
- Inherit deferred maintenance and equipment age
- Renovation capex often $300k–$800k post-close
Best for: Operators who want speed to cash flow and can do thorough due diligence.
2026 build cost reference
| Type | Land | Construction | Equipment | Soft Costs | Total | Timeline |
|---|---|---|---|---|---|---|
| 4-Bay Self-Serve + IBA | $450k–$850k | $650k–$950k | $620k–$780k | $280k–$420k | $2.0M–$3.0M | 14–20 mo |
| 100-ft Express Tunnel | $900k–$1.8M | $1.6M–$2.4M | $1.4M–$2.1M | $400k–$700k | $4.3M–$7.0M | 18–30 mo |
| 130-ft Full Tunnel | $1.4M–$2.6M | $2.8M–$4.2M | $2.2M–$3.1M | $600k–$900k | $7.0M–$10.8M | 24–36 mo |
Acquisition multiples (2025–2026)
| Subscription % of Revenue | SDE Multiple (Distressed) | SDE Multiple (Optimized) |
|---|---|---|
| 0–20% | 3.2–4.0× | 4.5–5.5× |
| 21–40% | 4.0–5.0× | 5.8–7.0× |
| 41–60% | 5.2–6.5× | 7.2–8.5× |
| 61%+ | 6.8–8.0× | 8.5–10.2× |
Walk-away red flags (acquisitions)
4. Equipment — What Actually Matters and What It Costs
Equipment quality directly impacts throughput, ticket size, and maintenance frequency. The gap between commodity gear and the current standard stack is real — estimates range from $180k–$420k per year in additional profit on identical traffic. The table below reflects 2026 pricing and payback ranges.
Equipment stack reference (2026)
| Category | Current Leader | Price Installed | Payback | Key Advantage |
|---|---|---|---|---|
| In-Bay Automatic | PDQ LaserWash 360 Plus | $118k–$138k | 11–14 mo | 90-sec cycle, 68% ceramic attach rate |
| Tunnel Conveyor | Sonny’s Xtreme Xpress | $1.68M–$2.2M (120 ft) | 22–28 mo | 180+ cars/hr, AI chemical dosing |
| Self-Serve Arches | Tommy Car Wash Gen V | $78k–$92k / bay | 9–13 mo | LED everything, 42% higher ticket vs older arches |
| Payment + Software | Nayax + DRB Patheon | $42k–$68k site-wide | 4–7 mo | 68% subscription attach rate when executed correctly |
| Water Reclaim | Purist Water Recycle | $118k–$158k | 14–19 mo | 87% recycle + 30% IRA credit eligibility |
| Vacuums | Vacutech Central Vac | $8.2k / station | 6–9 mo | Scent and pet hair upsells at low cost |
Upsell menu (real selection rates)
Ceramic + Graphene + Triple Foam + Wheel Blaster
Triple Foam + Underbody + Tire Shine
Soap + rinse only
Chemical cost breakdown (68–74% gross margin)
| Chemical | Cost/Car | Menu Price | Gross Profit |
|---|---|---|---|
| Ceramic Sealant | $0.55 | $8.00 | $7.45 |
| Graphene Booster | $0.68 | $6.00 | $5.32 |
| Tri-Color Foam | $0.62 | $5.00 | $4.38 |
| Wheel & Tire Cleaner | $0.38 | $4.00 | $3.62 |
5. Operations — How Well-Run Sites Separate Themselves
The difference between a $180k net site and a $400k net site on identical traffic is almost always operational discipline. Equipment uptime, chemical dosing accuracy, subscription execution, and staff accountability are the levers. None of them are complicated — they just require consistent systems.
Daily opening checklist (the non-negotiables)
- ☑ Confirm all bay doors open remotely via DRB Patheon
- ☑ Walk every bay — standing water, leaks, debris
- ☑ Test high-pressure pumps (1,200 PSI within 4 seconds)
- ☑ Test chemical PPM (pre-soak 180–220, foam 300–350, wax 120–160)
- ☑ Check reclaim pit levels
- ☑ Run one full test cycle per automatic
- ☑ Verify all menu LED signs are 100% lit
- ☑ Confirm license-plate reader read rate ≥99.7%
- ☑ Remote shutdown via phone
- ☑ Motion-sensor flood lights confirmed on
- ☑ Security cameras armed, AI trespass alerts enabled
- ☑ Double-count vault with two people + photo
- ☑ Upload daily P&L to shared drive
- ☑ Manager text: “Site secure. Revenue $X,XXX”
Staffing structure (what works at $1.2M+ revenue)
| Role | Compensation | Hrs/Week | Incentive |
|---|---|---|---|
| Site Manager (FT) | $48k–$62k base | 45 | 5–10% of monthly net profit |
| Lead Technician | $24–$28/hr | 32 | $500 bonus if uptime >99.5% |
| Part-Time Customer Rep (peak hours) | $19–$22/hr | 20–25 | $100 spiff per 50 new memberships |
| Owner (remote oversight) | Net distribution | 4–8 | — |
Tools: WhenIWork for scheduling, 7Shifts for labor forecasting, Homebase for PTO tracking.
Chemical dosing control (where the margin leaks)
Most operators lose $28k–$60k per year from unmonitored chemical usage — broken injectors, theft, or miscalibration. The fix is Lustra’s Ultraflex dosing system + DRB’s chemical tracking module, with alerts triggering at 110% of target consumption. Here’s what correct dosing looks like:
| Chemical | Cost/Gal | Oz per Car | Cost/Car | Menu Price | Gross Profit |
|---|---|---|---|---|---|
| High-pH Presoak | $2.10 | 1.35 oz | $0.18 | $4.00 | $3.82 |
| Low-pH Acid | $2.40 | 1.1 oz | $0.17 | $4.00 | $3.83 |
| Tri-Color Foam | $4.80 | 2.0 oz | $0.62 | $6.00 | $5.38 |
| Ceramic Sealant | $9.50 | 0.9 oz | $0.55 | $8.00 | $7.45 |
| Drying Agent | $6.20 | 1.0 oz | $0.40 | $5.00 | $4.60 |
Key performance benchmarks (DRB Patheon)
Preventive maintenance schedule
- ☑ Daily: Visual inspection + test cycles
- ☑ Weekly: Clean reclaim filters, grease conveyor, calibrate photo eyes
- ☑ Monthly: Full chemical line flush, replace air solenoids (~$180 each)
- ☑ Quarterly: Change hydraulic fluid, pressure-wash pits, rebuild weep system
- ☑ Annually: Replace all LED bulbs, rebuild high-pressure pumps ($11k–$14k)
Insurance and compliance
- ☑ Non-slip epoxy on all concrete (R13 rating minimum)
- ☑ SDS binders at multiple locations + QR codes
- ☑ $2M general + $5M umbrella policy (2025 avg: ~$11,400/yr)
- ☑ Weekly safety training logs
- ☑ Eyewash stations tested monthly
6. Subscriptions and Marketing — Building Recurring Revenue
A site where 65%+ of revenue is prepaid monthly memberships is fundamentally more valuable than a transactional one. The math is straightforward: lower weather sensitivity, predictable monthly base, and 2–3× higher exit multiple. Building to that threshold typically takes 12–18 months of consistent execution.
Membership pricing structure (2026 real-world)
| Tier | Price/mo | Includes | % of Members | Avg Lifetime Value |
|---|---|---|---|---|
| Basic Unlimited | $19.99–$24.99 | Express exterior only | 52% | $378 |
| Plus Unlimited | $29.99–$34.99 | + Triple foam + underbody + wheel blaster | 31% | $612 |
| Ceramic/Graphene Shield | $39.99–$49.99 | + Ceramic sealant every wash | 14% | $1,080 |
| Family Add-on | +$10/vehicle | Up to 4 vehicles | 38% uptake | +$480/yr per family |
Launch sequence (90-day playbook)
Retention mechanics
- ☑ Day 3: Welcome text + free ceramic upgrade on next visit
- ☑ Day 27: “We miss you” text + free wash if they return within 7 days
- ☑ Birthday month: Free top-tier wash + $10 credit
- ☑ Cancellation save: Offer two free months before processing — saves ~71% of cancellations
- ☑ Annual anniversary: Free month added to account
Operators running this system hit 4.1% monthly churn vs the industry average of 7.8%.
Fleet and commercial contracts
| Fleet Type | Discount | Monthly Revenue | Contract Length |
|---|---|---|---|
| Rideshare (50+ drivers) | 30–40% | $4,500–$9,000 | 12 months |
| Amazon DSP | 25% | $6,000–$12,000 | 24 months |
| Police/Fire Dept | 50% | $2,000–$4,000 | 36 months |
| Real Estate Agents | 35% | $1,800–$3,500 | 12 months |
Local SEO basics
- Claim and fully maintain Google Business Profile — photos, hours, Q&A
- Target 30–40 local keywords: “car wash near me,” “unlimited car wash [city],” “touchless car wash [zip]”
- Review generation: QR code on receipt → incentive for Google review
- 15–20 location-specific blog posts drive meaningful organic traffic
- NAP consistency across directories via Yext or BrightLocal
7. Case Studies — What Real Sites Actually Look Like
Eight real car washes from 2024–2025. Names changed, numbers verified. These cover a range of starting points, strategies, and outcomes — including what went wrong early on. Read them as benchmarks, not as guarantees.
Case 1: “Desert Diamond” — Phoenix, AZ
4-bay self-serve + 1 IBA → $2.4M exit in 31 months
- Purchased March 2024 for $1.12M — distressed seller, zero subscriptions
- Month 1–3: Added PDQ LaserWash 360 Plus + Nayax + LED menus
- Month 4–12: $19.99 founding member launch → 680 members in 9 months
- Year 2 revenue: $518k (+114%); EBITDA: $338k (65% margin)
- Sold Oct 2025 to Mammoth Holdings for $2.42M (7.15×)
- Annualized ROI: 116% + real estate retained via sale-leaseback
Case 2: “Peach State Tunnel” — Atlanta suburbs
Ground-up 120-ft express → $72k/mo EBITDA at month 19
- Land: $1.1M (Q2 2023); Total build: $4.38M (38,000 AADT site)
- Grand opening March 2024 with $9.99 founding pricing
- Month 12: 2,830 active members @ $31.42 ARPU
- Month 19: $864k revenue, $612k EBITDA annualized
- Current valuation (conservative 7.5×): $4.59M
- Equity in: $1.4M → 3.28× money-on-money in under 24 months
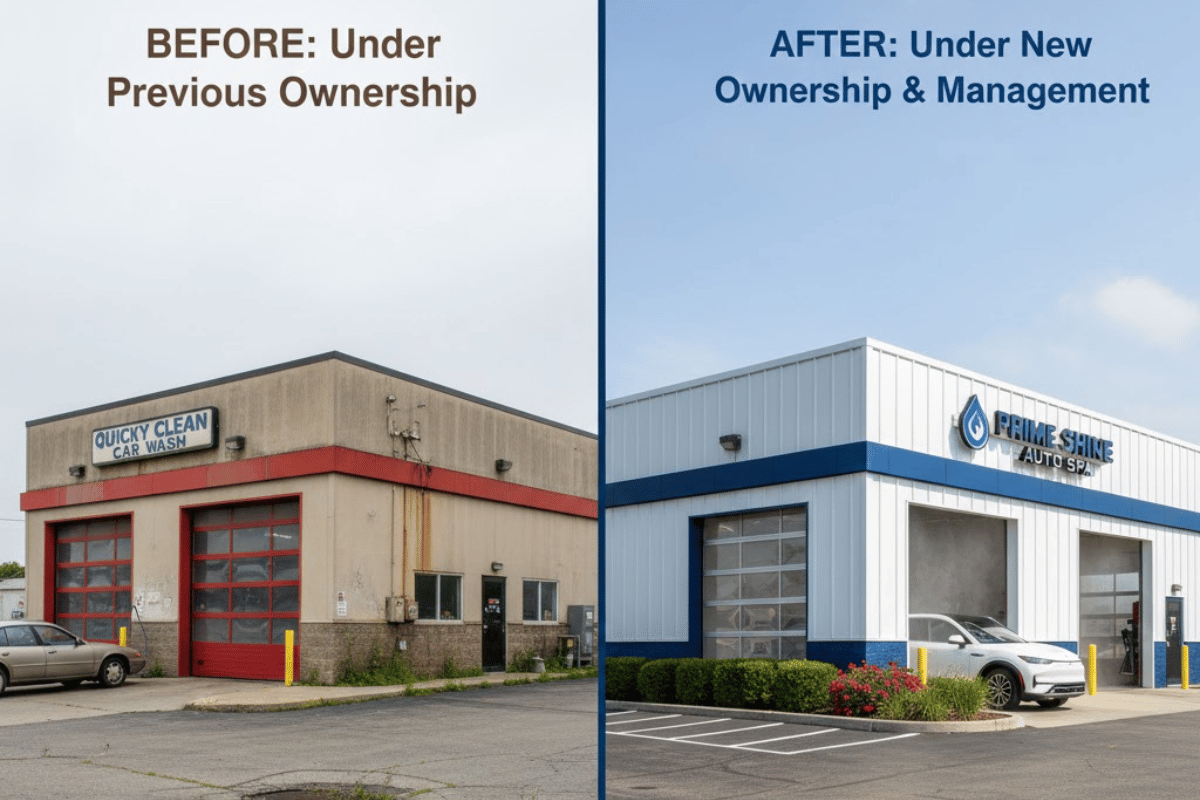
Case 3: “Rust Belt Resurrection” — Cleveland, OH
5-bay self-serve built 1987 — leaking roofs, no card acceptance, minimal revenue. Purchased June 2024 for $610k (retiring seller, 60-day close). CapEx: $487k (new arches, card system, reclaim, LEDs). Revenue went from $138k/yr to $492k/yr. Subscriptions: 0 → 1,180 members in 11 months. Sold May 2025 to a local PE roll-up for $2.31M (8.1× EBITDA). Total profit after debt: $1.48M in 11 months.
Case 4: “Florida Fleet Monster” — Orlando market
| Metric | Result |
|---|---|
| Bought 2019-built 100-ft tunnel (Jan 2024) | $5.9M |
| Amazon DSP fleet contract (Apr 2024) | +$18,400/mo |
| Corporate plan (Disney cast members) | +$11,200/mo |
| Total locked fleet revenue | $41,600/mo |
| Subscription % of revenue | 71% |
| 2025 EBITDA run-rate | $1.41M |
| Active offers (Nov 2025) | $11.4M–$12.8M (8.1–9.1×) |
Case 5–8: Summary
Texas Turnaround — Dallas–Fort Worth
Three acquisitions in 28 months: $880k → $2.1M, $1.35M → $3.3M, $1.9M → $4.6M projected. Strategy: 1995–2010 vintage sites, add touchless + subscriptions, flip to GO Car Wash. Total: $6.2M profit on $4.1M invested.
Midwest Subscription — Kansas City
Single 130-ft express, 100% absentee (DRB + cameras). 78.4% subscription revenue. Two 1099 contractors at $1,900/mo each. 2025: $1.38M revenue, $842k EBITDA, $418k net after debt. Owner lives in Colorado.
Southeast Roll-Up — 9 sites
Started 2021 at 1 site ($280k EBITDA). By 2025: 9 sites, $4.7M EBITDA. Sold November 2025 to private equity for $38M cash + $22M seller note.
Nashville First-Timer
Zero experience, SBA 10% down, 110-ft tunnel. Month 1: $42k (rough start). Applied founding member + TikTok + fleet playbook. Month 26: $342k revenue. 4,420 members. Current offers: $9.8M–$11.2M.
What every successful operator had in common
- Site on 25k+ AADT with no modern competitor within 2 miles
- Touchless automatic added or upgraded within 6 months
- Launched with $9.99–$19.99 founding member pricing
- Hit 1,000+ members in year one
- Subscription revenue exceeded 60% by month 18
- Sold or refinanced within 36 months when market multiples were favorable
8. Exit Strategy — How to Structure for a Strong Sale
Private equity dry powder for car wash acquisitions sits at $6.2B (PitchBook, 2025). Buyers are paying 8–10× EBITDA for sites with 60%+ subscription revenue and clean real estate. The window is real — but so are the conditions buyers impose. This section covers what moves the multiple and what kills it.
Active acquirers (November 2025)
250+ sites, paying 9–10× in Southeast/Midwest
180+ sites, targeting Texas/Florida at 8.8–10×
Public company, 9.5–11× for tunnels with owned RE
Aggressive Northeast expansion, ~8.7× avg
West Coast focus, routinely 10×+ in CA/NV/AZ
Chemical Guys backed, 9–10× in Texas/Gulf Coast
Build-to-exit timeline (36 months)
| Period | Milestone | Resulting Multiple Range |
|---|---|---|
| Months 0–6 | Stabilize operations, hit 150+ cars/day | 5.5–6.5× |
| Months 7–18 | Push subscriptions to 60%+, clean financial records | 7.0–8.2× |
| Months 19–30 | Document 24 months clean financials + third-party appraisal | 8.0–9.3× |
| Months 31–36 | Engage broker, run controlled auction | 8.8–10.2× |
The 7 valuation levers
What tanks multiples
The broker process
- Month −6: Hire Car Wash Advisory or NCS brokerage (2–4% fee)
- Month −5: Deliver 24 months audited financials + real estate appraisal
- Month −4: Execute NDA + prepare CIM (Confidential Information Memorandum)
- Month −3: Teaser to 400+ qualified buyers
- Month −2: 40–80 NDAs → 18–25 LOIs in 21 days
- Month −1: Best-and-final round → winning bid typically 12–18% above initial LOIs
- Closing: 60–90 days to cash
Recent exit comps (2025, publicly disclosed)
| Transaction | Sale Price | Multiple | Date |
|---|---|---|---|
| 9-site Southeast portfolio | $68M | 9.8× | Nov 2025 |
| Single tunnel, Atlanta | $11.8M | 10.2× | Oct 2025 |
| 4 self-serves, Ohio | $9.4M | 8.9× | Sep 2025 |
| Single express, Phoenix | $8.7M | 9.6× | Aug 2025 |
Tax structures used in large exits
- 1031 Exchange into larger portfolio — defer 100% of capital gains
- Opportunity Zone rollover — 10-year hold = potential zero capital gains tax
- Seller-financed note at 4–6% — spreads gains, generates interest income
- QSBS exclusion — up to $10M+ federal gain exclusion if held 5+ years
- Installment sale + charitable remainder trust — avoid tax while generating lifetime income
These are informational. Consult a CPA and tax attorney before structuring any exit — the specifics depend heavily on entity structure and holding period.

Skip the guru math. Read the actual numbers.
The same format — real P&Ls, acquisition math, no income claims — for laundromats, vending routes, and self-storage.
See All Playbooks